Tuesday, August 30

Begining Your Data Science Journey

https://cdn.analyticsvidhya.com/wp-content/uploads/2017/09/machine-.png

There are tons of data science resources but we often get confused on which resources to follow. I am sharing some steps I followed to learn data science on my own as a beginner. You can also check the links at the end of the article your learning and getting hands-on experience in Data Science.

Programming Language is must to start with Data Science

Whether you are a programmer or new to programming the first step while starting the Data Science Journey is to know programming language. Python is the most preferred coding language and is adopted by most Data Scientists. It is easy to understand, versatile, and Python supports various in-built libraries such as Numpy, Pandas, MatplotLib, Seaborn, Scipy, and many more. The 2nd preferred language for data science is R. Both Python and R learning resources are freely available on internet.

Learning SQL is important when you are working with data

Most programmers are expert on SQL and have worked with 1 or more databases. Structured Query Language (SQL) is used for extracting and communicating with large databases. When you are working with tons of data it is important to know how SQL is used to store & query data. You should have a good understanding of normalization, writing nested queries, group-by, performing join operations, etc., on the data and extract in raw format. This data is then processed using Python , R or any other library.

Cleaning Data is an important step of data processing

When a Data Scientist starts work on a project he has to deal with raw data which is not clean and can't be used for meaningful operations. One has to learn which libraries to use for cleaning the data set, removing unwanted values, formatting data to required format, handling missing values and purging unwanted data. It can be achieved by using some inbuilt python libraries like Pandas and Numpy.
When the data volume is small we can use MS Excel to process the data but Excel has limitations of volume and NOSQL and RDBMS database are used for storing volume data.

 Data Analysis is performed on cleansed data

Exploratory data analysis is the essential part when talking about data science. The data scientist has many tasks, including finding data patterns, analyzing data, finding the appropriate trends in the data and obtaining valuable insights, etc., from them with the help of various graphical and statistical methods, including:

A) Data Analysis using Pandas and Numpy
B) Data Manipulation
C) Data Visualization

You can learn basics of Exploratory Data Analysis from this blog posted by Prasad Patil  

What is Exploratory Data Analysis?

Learning Machine Learning 

According to Google, “Machine learning is a method of data analysis that automates analytical model building. It is a branch of artificial intelligence based on the idea that systems can learn from data, identify patterns and make decisions with minimal human intervention.”

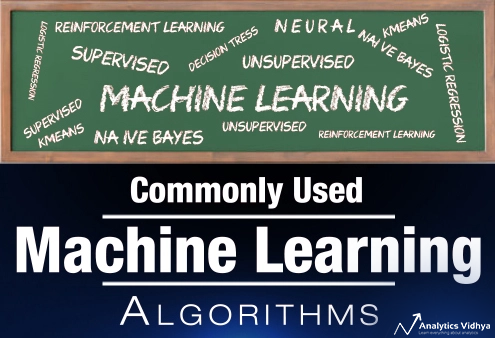
Here is the list of commonly used machine learning algorithms. These algorithms can be applied to almost any data problem:

  1. Linear Regression
  2. Logistic Regression
  3. Decision Tree
  4. SVM
  5. Naive Bayes
  6. kNN
  7. K-Means
  8. Random Forest
  9. Dimensionality Reduction Algorithms
  10. Gradient Boosting algorithms

Some Useful Links


Planning For A Smart City


Smart city services are born from a desire to be a good steward of public funds in the same way that innovations of the past were.Municipalities have always sought to provide top-quality services to their constituents as efficiently as possible and smart city initiative takes the service delivery to next level.


Planning smart city requires both a well articulated planning at the city level and a involvement & support from the community at large. Using data insights to streamline city services requires changing the physical services delivery and also the way administration works to approaches city planning. Creating smart city is not possible without involvement of the people, elected representatives,administration and private service providers. I was invited by one of the officials of the Smart City team to look at their new office and meet his team. It was an interesting experience and I got an opportunity to understand how the local administration was planning to integrate various services under the smart city initiative. On the path to becoming a smart city, the first implmentations are the most crucial to your project’s overall success. Being a software architect I could not help but give the team an overview of how we help Fortune 500 client to implement their project from defining the vision to a successful implementation. Like any new implementation , smart city planning is a set of processes to ensure that you are engaging your residents when necessary while also effectively managing the elements of your plan that are within your control. Every city has its unique footprint and one needs to understand that though the strategy remains the same the roadmap for Smart City implementation will be unique to each city.

1. Prioritize your city's priorities

Your local city community needs will drive which technologies and data you decide to collect first. As a city government, your priority may be anything from improving sanitation or stay animal management to improving transportation within city limits. You may even have existing services in place but may need a better system for managing existing assets. Way to start would be to conduct and audit, review your existing processes and identify areas that are in need of improvisation and innovation and then create a preliminary wish list to inform your planning process.

Once you have conducted an audit, it is important to engage your community to determine what common pain points that are affecting the people. This can be done at a public forum or town hall meeting, using any existing feedback mechanism or conducting contest to determine the most innovative ideas that your citizens can come up with. Local insights are invaluable as you decide where to most effectively allocate your resources, so get creative with how you solicit feedback. The services that affect most people if prioritized will deliver better support for next stage of implementation.

2. Define the vision for your City as Smart City

Very few people know that for implementing great software companies invest a lot in creating great training programs for the employee who are going to use the software. To get your community on board with your vision and start winning champions to your cause, you need to ensure that everybody is working toward a consistent set of goals. Smart cities are meant to be population-centric, so your goals should be measured against the impact your services will have upon the daily lives of your constituents. You may even consider making mission statement to guide your initial project and to provide a touch point to encourage future innovations. As an example, Columbus, Ohio “has a bold vision to be a community that provides beauty, prosperity and health for all of its citizens.” With this mission in mind, Columbus outlined a series of smart systems that led them to win the U.S. Department of Transportation Smart Cities Challenge in 2016.

3. Identify the business model

Many cities have a grand vision of what their smart city could look like, but not all communities can fully implement smart technology on their own due to budgetary or personnel constraints. You may be able to build, own and operate your own system, or a full public-private partnership could be attractive. Evaluate all of your options, including any models that exist between the two, to determine an implementation model that makes the most sense for your city.

4. Perform a gap analysis

A gap analysis is a method of assessing the differences in performance between a business' information systems or software applications to determine whether business requirements are being met and if not, what steps should be taken to ensure they are met successfully.  In order to evaluate your existing infrastructure and identify the steps necessary to realize your Smart City vision, conduct a gap analysis. If you are unsure of how to get started, there are several templates and tools available online that can be found with a quick search. Focus on determining what types of data need to be collected, and be sure to identify the technologies you would like to use relatively early in your process. This way, you can identify the seams and overlaps between different systems, reducing the likelihood of incompatibility issues arising later in your implementation.

5. Outline financing and budgets

While your budget will inform your implementation model as noted above, at this stage it is imperative to focus on short-term, mid-term and long-term implementation ranges. Now is also the time to build a business case for any efficiencies that you expect to gain through the implementation of smart technology. Even this far along in the process, it is a good idea to sell the benefits of your vision to stake holders.

6. Capture the low-hanging fruit

Low hanging fruits give quick and assured results. With a clear view of your budget, identify and group existing assets that are readily scalable to city-wide use. For example, you may be able to integrate your existing transportation infrastructure with utilities and community services. This is the time to focus on the big picture, and you will want to have access to any data and visuals that will allow you to do that. Look to your geographic information system (GIS) or technology department to perform scenario analysis using digital mapping or similar platforms to understand potential areas where connectivity would be required and to identify weaknesses. Parcel data, zoning, and land use information available through location intelligence will all be vital when the time comes to scale your deployment following the pilot phase.

7. Develop and implement pilot projects

When the time comes to deploy your new smart systems, be as targeted as possible with how you roll out your pilot program. Start small in order to better maximize learning opportunities and measure your early successes, and look for an early win you can use to create momentum and positive buzz in the community. Regularly review your smart city vision against the available data to ensure your plan will grow with your community’s needs. If you are struggling to replicate early successes as you expand your offering, then look for patterns in the data that may illuminate ways that you can do so.

Ultimately, the long-term success or failure of any large-scale implementation of smart technology will be determined by the measurement and optimization efforts that take place after deployment. However, by mindfully applying these few steps, you can be assured that your community has placed its best foot forward on the path to becoming a smart city.

Thursday, August 18

Every Child Should Get Education & Nutritious Meal

I have been supporting Akshaya Patra for many years since I came to know about this great idea called 'Mid Day Meal'. Many children from poor families do not get a nutritious meal and Akshay Patra along with government of India provides meals to such schools ensuring no kid remains hungry. The food provided to school is especially prepared for the children at kitchen created & maintained by Akshaya Patra which ensures the quality & nutritious value of food meets quality standards. The food is transported from kitchen to schools in special vehicles and served to children in most hygienic way. I came to know that as of Aug 2016 Akshaya Patra is feeding Mid Day Meals to more than 1.5 million children daily which makes Akshaya Patra world’s largest (not-for-profit run) mid-day meal programme serving wholesome food to over 1.5 million #children!

Being associated with the NGO and having visited their kitchen and schools gives me the satisfaction and confidence that at least 1.5 million students are getting nutritious food and quality education in government schools and the number will keep growing as more and more people will donate to this cause. We all want to do something for the society, we are all concerned that our hard earned money should be utilized in most efficient manner and we want to see the proof that the money is utilized well. I think everyone should visit the Akshaya Patra kitchen to see their modern kitchen where they prepare food for the kids and that will convince you to sponsor Mid Day Meal of at least one child by donating INR 750 (USD 11) or or 3 children INR 2250 (USD 33). When you visit the kitchen or schools you will hear motivating stories of children and some sad stories on how some parents could not afford a balanced meal for their children. I have heard stories of parents who did not send their children to school but now they send the children so that the child can get a meal and education at the government school. Fact is government sponsors such initiatives from the tax they collect from you and me and they have limitation on how many schools they can support from the tax money. People like you and me who want to do their bit and do not have time to contribute can sponsor meals of 3 children every year ( at approximately 2200 Rs which is cost of one dinner for 2 people at a 3* hotel) we will ensure that 3 children will not drop out of school because of poverty and hunger.

Do visit the web site of and know more about their. And don't forget to do your bit every year! Cheers!

Monday, August 1

Digital India is also about using technology to maintain pothole free roads

Last week I was on vacation and traveled to the beautiful & historical city of Aurangabad. What could have been a wonderful vacation turned out to be a bone jarring experience while driving to various historical spots in the city.  The locals told me that the excuse given by local government is they are not aware of the potholes and as soon as they are informed they try their best to fill the pot holes. The local government should be concerned about the potholes because apart from being danger to life of residents (In India more than 10000 people die because of accidents due to pothole), potholes are bad news for tourism as well. Every tourist friendly country across the world boasts of good roads and neglecting the roads will have adverse affect on the tourism revenue.
             In Digital India governments cannot have such flimsy excuses of not doing their job of maintaining the roads. The local government should be using technology to report, locate and monitor occurrence of potholes. Almost every civic official carries a smart phone and the accelerometer in a smart phone can sense when a vehicle encounters a pothole or sudden dip in the road. With some effort we can build an algorithm that can use accelerometer data, GPS data to build an application that can be used to report potholes and even the severity or size of the potholes. Using crowd sourcing large amount of data can be collected which can be further processed to validate the pothole locations. Smartphone used by drivers of City buses and government vehicles that travel across the city could be primary source of pothole data.
                                I anyone has any experience on building such an application do share your feedback with me. I hope mayors of Aurangabad and other cities that face problem of potholes are made aware that with minimum investment and some incentive to their employees government can build a system that will ensure their road are monitored 24/7, potholes reporting is automated and they can even cross check the claims of contractors who are supposed to fix the potholes saving millions for the government and residents.


Friday, July 1

Personal Health Record Data Management - Need of the hour

One of the most important and crucial data for an individual is his Personal Health Record Data. Analysis of your historical Personal Health Record Data can help the doctor do much better analysis of your health and even predict diseases by looking at your historical medical test records.
 
My own definition of Predictive Analytics - The art of using multi dimensional historical data and predicting some event with high probability is called Predictive Analytics. Take a simple example of predicting your food craving for today by analysing your eating habit for last 12 months and you realize how predictable humans can be. You thought you ordered the unique combination of dishes but if you analyse your eating habits data you will realize you had just ordered food that you have been eating for ages but maybe prepared in a different style! ON lighter note, one of my good Punjabi friend once said he has been eating Aloo Parathas from the day he remembered and he is going to change his diet.  I had never hear of a Punjabi saying no to paratha's so I curiously waited to hear what my friends would order and he ordered Gobi Paratha :) , so much for change of diet! (Here is a good Aloo Paratha Recipe  by Chef Sanjeev Kapoor for those who have not tried Aloo Paratha) 

Early detection & treatment of many critical illness like Cancer, Heart Disease etc can give you and your doctor a head start to tackling the disease early and improve the chances of cure. The 'insights from data' from medical tests that you have done all your life can give key insight to you and your doctor if the historical data is available for analysis in digital format. Historical data does not mean years of data, even 3 months clinical record data can give reasonably good prediction and going forward as the number of records increase your software's predictive ability keeps improving incrementally.

Unfortunately we are not in habit of maintaining our Personal Health Record Data over the time. Out health care systems are driven by commercials considerations and countries do not have adequate systems to maintain personal medical history from birth on wards.

I am speaking from my own experience on how we faced challenge to diagnose an illness because we were not familiar with Health Records, did not see the deviation in CBC reports (Complete Blood Count) parameters. We kept visiting a General Practitioner who did not interpret the data and only when we visited a specialist we came to understand the medical data that helped us diagnose the critical illness.
As a software engineer when I analyzed the situation I realized that if we had medical records in digital format and a software to view the records it would have been quite easy to identify the parameters that are deviating from normal acceptable range and it would have been much easier for the doctor to diagnose the disease. For patient with chronic illness it is critical to keep a watch over changing parameters even before you share the data with your doctor and a simple mobile application would help the patient to monitor his/her health.

There are 3 key points to note
1) There are standard acceptable range of values for each medical parameter of human body
2) Every person could have unique values for the standard medical parameters that may be lower or higher than the ideal range recommended by medical standards
3) Every illness will cause some deviation in personal medical parameters

So a software that is built considering the above the points can be customized to monitor health and change in health of each individual. With incremental propagation of mobile devices it is only logical that mobile devices are the best bet for Personal Health Monitoring Software that will empower each individual to Save, Analyse & Share his medical data on the go.  Unfortunately neither the hospitals nor the government health services have focused on leveraging the Mobile to empower the patient to Collect & Digitize his/her medical records. I would have expected private companies in healthcare to leverage this opportunity to provide free software to the public to maintain their medical records and also use the software to build customer loyalty towards their brand. What is clearly lacking is a long term vision and intent to provide better health management for people.
                                           What is required today from IT service providers is to bridge the gap between people, hospitals, insurance companies by  building software that benefits all the parties.
1) People require a software that is free to use
2) Doctors, Hospitals, Labs & Insurance companies require a software that build customer loyalty, helps retain customers and can act as a channel to push notifications & promotions.
3) Doctors would like a software that helps interpreting data in a better way by digitizing the data and using sophisticated algorithm to predict illness or detect them in early stages. Mobile software reaches to the end customer who are slowly moving away from 'laptops to tablets & mobile' and increasingly becoming dependent on their mobile phones.

USA has few service providers and they have a unique model but their focus is different and focused on saving operational cost and not so much focus on value for patient and for doctors. The need to have a 'mobile software for the patient & for doctors'. The company that provides such software service will build a new segment in Asian continent & also in the Europe & USA and set the pace for next medical revolution that will build population of  'data aware health service consumer'.


Sunday, June 19

Don't waste your evening at office. Your kids have somuch more to give to you! Happy Fathers Day!

Most wonderful day of the year to be with my son Ishaan, my niece Alisha, dad & mom. Feels wonderful to have the little ones spread all the joy in my life & cherish the love showered by our parents.

Every year take couple of day off, get away from laptop, tablets & phone and spend the day exclusively with your kids. You realize that there is so much more in life than Big Data & Digital! There  is so much more than keeping your clients and boss happy. There is Figaro the cat, Hot wheel cars, making cardboard Car Garages & Doll houses, playing pretend cooking & hunting non existant Dinosaurs that come in the night! Spending time with kids is so much fun and super exciting! So don;t waste your evenings at office


Thursday, June 16

Digital India before Digital World

Past one year Indians have been riding the Digital Wave, from the prime minister to the local MP everybody wants to do something to be part of the Digital India wave. Funny thing is when I came across our local Member of Parliament he told me his idea of going Digital was to launch his long pending website ! I could not resist and I ended giving him a 5 mins Booster Lecture on Digital. I will share my view of Digital India and how India is implementing Digital at various level at a later date. As 2016 begins to settle in, now is the ideal time to look at how technology will be driving digital transformation in businesses.
The digital transformation wave
While new technologies continue to provide the ability to transform business models, effectively engage customers and improve efficiency of business operations, the majority of organisations were still struggling with the basics in 2015, trying to keep up with the application backlog and managing IT infrastructure and user devices. At the same time,  forward-looking organisations are putting user or customer engagement at the top of their technology agendas. Led by the need to think about the entire customer engagement journey, across all digital platforms (mobile, web sites and so on) and in-person interaction, more and more companies will focus their efforts on their own digital transformation in 2016. They will extend traditional systems or systems of record that house core data assets, by delivering applications that engage customers and employees more effectively and provide analytical insight. Organisations that don’t make this transition will be left behind.

From leveraging Big Data to the modernization of core business applications, the to-do list for everyone from the CTO to the CIO to your developer team has never been greater. So what are the key factors driving digital transformation? 
1) The modernization of core business applications
To compete in this increasingly mobile, social world, companies must find ways to engage customers and prospects in a more digital way. Modernising apps to play well in the digital space will be a must. The websites built by sophisticated market players who realize digitizing the enterprise is a critical component of future success will proliferate; no longer is the website a simple billboard for the company, it is an interactive, dynamic resource that encompasses the next generation of application development. 
2) Digital interactions merge channels and break down silos

In 2016, biggest realization for organizations should be 'There is no web & mobile strategy : only a customer-centric digital strategy, regardless of channel'. There is no marketing data, sales data and support data : only the customer life-cycle data. Companies will endeavor to provide the best experience based on the combination of individuals and where they are in the lifespan of their relationship with the organisation, from new prospect to long-term buyer. In 2016, digital strategy will mature as companies get serious about bringing together all customer and prospect information and goals, and how best to serve them with a single, continuous digital strategy. Recently Airtel has decided to share the location of their mobile towers with their customers to bring in more transparency, a month back the mobile companies refused to share the data with customers! The past five years were about bringing commerce, marketing, sales and support online. The next five will be about bringing them together by understanding the journey and making it better, cheaper and faster. 
3) Big data insights will be extended to the enterprise including mobile devices 
today the choice of applications that leverage big data, machine learning and so on is where the advantage lies. This first wave of big data focused on the infrastructure stack–storage, scale and integration. It’s actually the next wave of technology that is more exciting because it will make big data mainstream and consumable by everyone. Companies will stop thinking about big data as a big data warehouse to be managed and scaled. Instead, they’ll think about the marketing analytics application that automatically provides the next best piece of content to users and drives higher conversion levels. True big data value will emerge from this next wave of applications and services.

From 2016 to mid 2017 we should see 'Watchers' evolve from reading about Big Data transformation to actively implementing it themselves. The success of the competitors is going to drive the late starters to evolve to survive if not to succeed.


Sunday, June 12

Should you learn Phyton or R ? - For Aspiring Data Science Students

Why Python is preferred for data science

  • Guido van Rossum created Python
  • Python was released in 1989. It has been around for a long time, and it is object-oriented
  • IPython / Jupyter’s notebook IDE is excellent.
  • There’s a large ecosystem. For example, Scikit-Learn’s page receives 150,000 – 160,000 unique visitors per month.
  • There’s Anaconda from Continuum Analytics, making package management very easy.
  • The Pandas library makes it simple to work with data frames and time series data.

Why R is preferred for data science

  • John Chambers created R and prior to that he created S
  • R was created in 1992, after Python, and was therefore able to learn from Python’s lessons.
  • Rcpp makes it very easy to extend R with C++.
  • RStudio is a mature and excellent IDE.
  • CRAN has many machine learning algorithms and statistical tools.
  • The Caret package makes it easy to use different algorithms from 1 single interface, much like what Scikit-Learn in Python
I started by learning R and then picked up Phyton. I personally think Phyton is much more versatile than R but it is good to learn both the languages.

Tuesday, May 3

Value creation from Big Data & Analytic in the Insurance Industry

Insurance company have to imbibe a culture where business leaders trust Data Analytics and act on the insights provided to get maximum value from the potential value of Big Data. Insurers should take steps to create that culture today if it doesn’t already exist in their companies.
The key is to start small with a PoC. Following is an example of how insurers can leverage a Big Data platform and some key considerations to keep in mind. In this example, IT is interested in using a Big Data environment to speed up long-running ETL processes in a traditional data warehouse environment, because the traditional processing is leading them to miss reporting SLAs for business.


Big Data Challenges: Insurers are faced with a number of factors that combine to make Big Data a big challenge:

  1. Proliferation of channels and the explosion of data
  2. Increasingly competitive landscape, especially in the P&C and life sectors
  3. The financial tsunami of the past several years, as well as the resulting increasingly demanding regulatory requirements in both North America and Europe

  4. An unusually high number of catastrophic losses caused by natural disasters like brush fires, hurricanes, earthquakes in recent years;
  5. Siloed data environments. 
Having said that, it is important for insurers to develop a good business use case for meeting the strategic objectives of that line of business. In addition, solid backing from top level executive is extremely important not only for funding, but to evangelize and communicate the objectives and need for adoption of Big Data to the entire organization, including partners and vendors. Although the scope and investment in terms of people (a dozen employee big data team), tools (for example, open source Hadoop ecosystem), technologies and infrastructure might be small, the architecture should keep the long term view in mind. For the effective harnessing and harvesting of Big Data, close collaboration between IT and business is imperative to iteratively experiment and drive actionable insights by building proof of concepts. Insurers can then use this incremental success to get increased funding for next phases and/or use cases.

Insurers who aren’t exploring and embracing Big Data, and developing a Big Data strategy will find that they are losing their competitive advantage. They will be unable to get actionable insights from the mountains of data flooding into their organizations. Some of the key findings of the market research with respect to Big Data adoption and opportunity in Insurance vertical were: 
  • A vast majority of insurers are using analytics for actuarial  & pricing  processes. Very few insurers are using analytics to improve operational areas like sales, marketing or optimized work assignment for underwriters & claims adjusters. 
  • Relatively few insurers have got a comprehensive Big Data strategy and are reaping its benefits However most insurers are planning their Big Data approach.
  • Even fewer insurers capture, persist, and analyze Big Data within their computing environment today, but those that do typically leverage traditional computing, storage, database and analytics, in addition to newer platforms such as the Hadoop ecosystem. 
  • Larger insurance players plan to embrace Big Data and analytics across all financial and risk management areas while less than 50% of the smaller insurers are planning the same actions.

Tuesday, April 26

US Elections : The one who leverages Big Data will win the elections !

It is said that in 2012, "Obama's campaign began the election campaign knowing the name of each one of the 69,456,000 Americans votes who had voted him to White House."  So Obama knows each American who voted for him! Don't worry, it's not just Obama, by now Donald Trump, Hillary Clinton & all other presidential candidates know a lot about each American voter.

Scary? Well don't blame the candidates, the digital foot print that each one of us leaves every minute of the day creates enough data so that even the dumbest computer with 512mb RAM knows more about you then you can imagine! What you buy, what you read, what you say on social network, what you like and what you dislike, who you associate with, what your mood is morning/noon/night, where you work, what you do, what is your health situation, where you've donated, what clothing styles you like, what car models you buy, your favorite Cola brand, your favorite phone brand, the medicine you buy-- all of that information is available to those with the budget to buy the relevant data & have the algorithms to aggregate and analyze the data. One Super market chain was once rumored to have predicted 'pregnancy of its woman consumers based on their digital footprint and they did not even use the social media data' (think about it when you post personal opinion on social media)

So how do political analyst use this data? Assume you were a soccer mom, a broke- & angry, a comfortable middle-aged guy, etc. Each of those demographic and psycho graphic categories will help decide a campaign target resources. All the candidates need is a team that can use some data crunching and parallel processing software like Haddop along with analytic dashboard to fit you into a category, overlay that to a region, and they have their campaign plan along with 'draft' for the candidate speech that mentions what to cover in the speech and what not to cover.
Using Big Data & Analytics one can identify favorable localities for the candidate, identify the top demand and concerns that matter to the voters of each locality, identify active voters by age group in each locality and that helps define 1/more profiles of the voters of a region which can be used to plan strategy for the campaign. The campaign teams knows what ads to put, what issues to raise in local ads, how to collect funds and what should be the content of the speech.  If they have smart Predictive Analytic software I am sure the presidential candidates know who you are going to vote for even before you have thought about it. Scary but true.
            We used a set of social media data available on the web to find if it comes to Hillary vs Trump showdown who would win. The results were interesting as Donald Trump seemed to have an edge in  Jan 2016 but in 3 months public sentiments seem to have changed and social media favours Hillary Clinton and she could be a clear winner with 20% higher votes if she becomes the democratic nominee!  So if Ms Hillary Clinton' team is using Big Data Predictive Analytics & her team is giving him smart insights to strategize her campaign, which I am sure they are, then Hillary Clinton would be the next US President.  Don't forget you read it here first!

Data Strategy - Hadoop cannot replace DWH

I was discussing Hadoop architecture with a team and the meeting ended in agreeing to disagree on the architecture! There seems to be a confusion among new generation data experts about Data Warehouse, Data Marts & Hadoop Data Lakes.
                                                          Data Warehouses were designed way back in 1980s and the idea was to design a data reflection of the business to be used for analytics. I do not think the concept of DWH changes with advent of Big Data and yet we keep hearing of Hadoop will get rid of DWH. there could be cases where Hadoop Data Lake would serve the business purpose but to say that it is a replacement of Data Marts & Data Warehouse is incorrect.The integration in Data Warehouse is not just to arrange and store data for business but it also takes care of 'cleansing data to solve various data quality & validity issues' that affect business.
                                                       

Tuesday, March 8

How insurance Industry Can Leverage Big Data

I have written about various industries using Big Data and today we will go through some pointers for Insurance Industry. Having worked for implementing 2 solutions for insurance industry I am aware of the challenges faced by the industry.  Insurance Industry data today comes from disparate sources that include customer interactions across channels such as call centers, telematics devices, social media like Facebook & twitter, agent conversations, smart phones, emails, faxes,  day-to-day business activities and others sources.
                                                       Most of the data processed by organisation today is structured data and it is hardly 10% of the data available. Insurance company can reap real benefits like
1) Increased productivity
2) Improved competitive advantage and
3) Enhanced customer experience
4) Derive business insights and business value from Data Analysis
by capturing, storing, aggregating, and eventually analyzing the data from new age sources. The value comes from harnessing the actionable insights from this data.  The strategic objectives of the Insurance Business can be achieved by  having a well defines Business Objectives & KPI, clearly defined Business Intelligence requirements and Analytical requirements that help the Data Science team to define the Data Processing for Big Data thus leveraging the 100% data rather than 10 to 20% data that is leveraged today by the industry and achieve actionable insights to achieve the Business Objectives. Clearly just having a Big Data strategy is not enough and we need a well defined custom Analytic Strategy that extracts the true value of the data for the business. In other words the business should have a 2 independent approaches & 2 set of experts to process big Data and to perform analytic on Big Data, these are unique streams of IT , their goals are unique & one should not expert expertise across these 2 technologies ( I must admit there are a handful of people who do have expertise across technologies but the technology is still very new).
                                                        Investing in Big Data, like any other technology should be a phased process starting with Business Vision, Strategic Objectives, Technology Vision,Priority Business Cases and Prototyping and finally refinement to the Vision and Strategy. Real value is derived when actionable insights can make a positive difference in achieving the Insurance organization’s strategic objectives. (Is this is too technical for some industry readers I will be happy to simplify it).

Once prototype is successful it is easier to convince the business to invest in Big Data & Analytic Strategy.
Key points for the business to consider
1) By tapping into more than 80% of untapped data business will discover new insights
2) Processing of entire data gives better transparency and accurate perspective to the the business
3) Big Data & Analytic require complete digitization thus enabling 360 degree insight
4) We are also enabling Real time or near real time processing of data that will enable insurer to experiment with products to identify needs of customer which helps in deliver new products and retaining existing customers

Next we will discuss the value creation from Big Data & Analytic & enabling a Real Time Insurance Enterprise.


Monday, February 8

By-product of Digital Revolution Part-1 - Increasing Mobile Devices & Health Concerns Due To Mobile Radiations

For many months now I have been doing research on Mobile Towers, Radiations & potential health hazards due to concentration of mobile radiations and I want to share some information to create awareness.
          Increasing concentration of mobile phones and mobile towers is a concern that very few people are aware of. Mobile tower radiations in particular are harmful beyond a certain limit. Unfortunately in India government and mobile companies do not have strict policies and they don't test radiations. It is important for people to read about mobile radiations particularly if you stay or work in the vicinity of mobile towers. I know people who have lived near a Mobile tower and are suffering from Cancer through their is no definite scientific evidence to support the case. 

     We have to understand that our generation (those in 40s) was not affected by mobile radiations till the age of 20 but today's children get exposed to radiations from day-1 and by the age of 12 they start using a mobile so the effect of radiations could be more severe . Mobile industry is growing and it is a cash cow for the government and neither government nor mobile company care about the heath issues of mobile radiations.  There are many scientist who have been doing research on mobile hazards & I recently started interacting with Prof Girish Kumar (Dept of Electrical Engineering at IIT Mumbai). Dr Kumar has been doing research on mobile radiations & their effect on health and he has been creating awareness on this issue for more than 7 years now. I am going to share some of the research docs with my friends circle. Please share it with your friends to create awareness. If you need data collected by Dr Girish Kumar you can write to him or to me and I will share the data with you. 

Tuesday, February 2

What is Technical Architecture ? Common Technology Architecture Terms

Technical Architecture is
1.    A formal description of a system, or a detailed plan of the system at a component level to guide its implementation.

2.    The structure of components, their inter-relationships, and the principles and guidelines governing their design and evolution over time.


Key Terms
  1. Activity: A task or collection of tasks that support the functions of an organization; for example, a user entering data into an IT system or traveling to visit customers.
  2. Application :A deployed and operational IT system that supports business functions and services; for example, a payroll. Applications use data and are supported by multiple technology components but are distinct from the technology components that support the application.
  3. Application Architecture : A description of the major logical grouping of capabilities that manage the data objects necessary to process the data and support the business.
  4. Building Block : Represents a (potentially re-usable) component of business, IT, or architectural capability that can be combined with other building blocks to deliver architectures and solutions.
  5. Architecture Building Block (ABB) : A constituent of the architecture model that describes a single aspect of the overall model.
  6. Business Architecture : The business strategy, governance, organization, and key business processes information, as well as the interaction between these concepts.
  7. Architecture Principles : A qualitative statement of intent that should be met by the architecture. Has at least a supporting rationale and a measure of importance.
  8. Architecture Continuum : A part of the Enterprise Continuum. A repository of architectural elements with increasing detail and specialization. This Continuum begins with foundational definitions such as reference models, core strategies, and basic building blocks. From there it spans to Industry Architectures and all the way to an organization’s specific architecture.
  9. Architecture Development Method (ADM) : The core of TOGAF. A step-by-step approach to develop and use an enterprise architecture.
  10. Architecture Domain : The architectural area being considered. There are four architecture domains within TOGAF: Business, Data, Application, and Technology.
  11. Architecture Framework : A foundational structure, or set of structures, which can be used for developing a broad range of different architectures. It should contain a method for designing an information system in terms of a set of building blocks, and for showing how the building blocks fit together. It should contain a set of tools and provide a common vocabulary. It should also include a list of recommended standards and compliant products that can be used to implement the building blocks.
  12. Architecture View : A view is a representation of a system from the perspective of a related set of concerns. A view is what you see (or what a stakeholder sees). Views are specific.
  13. Architecture Viewpoint : where you are looking from; the vantage point or perspective. Viewpoints are generic. A model (or description) of the information contained in a view.
  14. Architecture Vision : A high-level, aspirational view of the Target Architecture. / A phase in the ADM which delivers understanding and definition of the Architecture Vision /Level of granularity of work to be done.
  15. Baseline : A specification that has been formally reviewed and agreed upon, that thereafter serves as the basis for further development or change and that can be changed only through formal change control procedures or a type of procedure such as configuration management.
  16. Baseline Architecture : The existing defined system architecture before entering a cycle of architecture review and redesign.
  17. Business Governance : Concerned with ensuring that the business processes and policies (and their operation) deliver the business outcomes and adhere to relevant business regulation.
  18. Capability : An ability that an organization, person, or system possesses. Capabilities are typically expressed in general and high-level terms and typically require a combination of organization, people, processes, and technology to achieve; or example, marketing, customer contact, or outbound telemarketing.
  19. Concerns : The key interests that are crucially important to the stakeholders in a system, and determine the acceptability of the system. Concerns may pertain to any aspect of the system’s functioning, development, or operation, including considerations such as performance, reliability, security, distribution, and evolvability. Longer lasting than problem (eg. state of the economy), not a requirement, which is short term.
  20. Enterprise : The highest level (typically) of description of an organization and typically covers all missions and functions. An enterprise will often span multiple organizations.
  21. A "pattern" has been defined as: "an idea that has been useful in one practical context and will probably be useful in others" [Analysis Patterns - Re-usable Object Models].

Mobile Phone are contributing more Big Data then you can imagine

According to IDC by 2016 60% of internet traffic will come from wireless devices as opposed to desktops. Couple of years back one good-for-nothing senior at work asked me if I think programmers can use Ipad to replace laptops/desktops and I thought he had one drink too many, but now I am not so sure...

Mobile apps are constantly producing a tons of information like user behavior data (session starts, events, transactions) and machine generated data (crashes, apps logs, location data, network logs).  The volume, value & velocity in this constant stream of mobile data qualifies it as “Big Data”.

Mobile applications are necessity and Mobile Big Data is reality. To capitalize on the wealth of mobile data from smartphones, the challenge of collecting, analyzing and acting on data while it was still relevant had to be met. Mobile developers have the competitive business edge because they can identify factors that impact user behavior as they happen, they can be more reactive, prioritize more effectively and meet customer needs more effectively.

What is different about Mobile Application data is that the data 'has to be processed at high speed' to give user experience. The technology that helps high speed processing in real-time is in-memory databases. In-memory databases provide the “in-motion” part of Big Data – that is processing the data at an exponential pace and providing results while they still matter.  In-memory databases provide in-motion, real-time, in-memory data processing from mobile devices. The other area of application of in-memory databases is  collecting, analyzing and trending data from sources like cars and home systems, all at the speed of business.

Understanding Generative AI and Generative AI Platform leaders

We are hearing a lot about power of Generative AI. Generative AI is a vertical of AI that  holds the power to #Create content, artwork, code...