Sunday, April 23

Understanding Technology Architecture (1)

Apart from working as software engineer & technology architect for over 18 years, I have also been conducting training & workshops on Technology Architecture for many years now. People often ask me to share articles on Technology Architecture that they can read and learn about technology architecture. There are many papers published on the internet but not all of them are easy to understand and some of them are quite dull and boring. I am going to start posting about Technology Architecture in the way I explain it to my workshop participants and hopefully people will find it useful read.
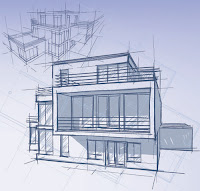
                                                              A building architecture 

What is Technology Architecture?

When constructing a building an Architect interact with customer to understand the requirements and how the building will be used and then he create the architecture blueprint that gets reviewed & approved by the civic authorities before a civil  engineer starts the construction of the building.Once the blueprint is ready the architect will use the blueprint to explain to the builder, civil engineers and contractors about the type of foundation, material that should be used and how to build the building.
                                                       In software engineering the Technology Architect creates the Technology Architecture which at nothing but set of high level components that will help him create the architecture blueprint.Once the blueprint is ready the architect will use the blueprint to explain to the development team how the software should be constructed.So Technology Architecture is the blueprint of the software solution.
The Technology Architecture defines
1) the building blocks of the software
2) the relationship of blocks with each other & how the blocks will work together
4) how the current & future business requirement are being met by the solution
5) the standards that are to be followed
6) how solution can reuse certain components of the block
7) how to meet the technical and non-technical requirements ( system performance, throughout, response time, security, scalability etc)

                                            Snapshot of Technology Architecture blocks 


Note- The above sample image is of Microsoft Azure Architecture Blueprint

Thursday, March 30

Android Studio How to quickly install and use ADB

 ADB stands for “Android Debug Bridge” and it basically just allows you to send commands to your device. A common misconception is ADB is only useful in conjunction with root access, but there is a lot you can do with unrooted devices. You can bring System UI Tuner options to non-stock devices, force system-wide Immersive Mode, tweak the navigation bar, and more. Google makes it easy to get ADB up and running quickly. 


ADB is a small tool bundled in the Android SDK as part of the “Platform Tools.” Users used to be required to download the entire SDK (which is very large) just to use ADB, but Google now allows users to download only the Platform Tools.
  1. Download the SDK Platform Tools for Windows, Mac, or Linux
  2. Extract the ZIP file somewhere easily accessible (like C:\platform-tools)

Now we need to do a few things on your Android device. First, you’ll need to enable the secret Developer Options. Skip this step if you already enabled Developer Options.
  1. Open Settings
  2. Scroll down to System (step 3 not required for pre-Android Oreo devices)
  3. Select About phone
  4. Tap Build number 7 times in quick succession (some phones will bury this under Software info)
  5. You will see a message appear that says Developer Options are enabled
  6. Now go back and you’ll see Developer Options listed
With that out of the way, we can enable USB debugging.
  1. Open Settings
  2. Go to System > Developer options or just Developer options
  3. Scroll until you find USB debugging
  4. Toggle the switch on
You have ADB downloaded on your computer and your Android device is ready to receive instructions. Now it’s time to put it all together and run your first ADB command.
  1. Connect your Android device to the computer with a USB cable
  2. The USB mode must be PTP in order for ADB to work. You can usually change this from the notification shade
  3. Make sure to allow USB debugging if a pop-up appears
  4. Open the platform-tools folder on your computer
  5. Shift+Right Click and select Open command prompt here
  6. Type adb devices and hit Enter
  7. You should see a list of attached devices
  8. Now you can enter ADB commands!

Friday, March 17

Right time for Big Data As A Service

Over the years we’ve had offerings like Software as a Service, Platform as a Service and Data as a Service. Now, by mixing them all together and massively up-scaling the amount of data involved, we’ve arrived at Big Data-As-A-Service. It might not be a term you’re familiar with yet, but it suitably describes a fast-growing new market. In the last few years many businesses have sprung up offering cloud-based Big Data services to help other companies and organizations solve their data dilemmas. Some estimate that the portion of business IT spending that is cloud-based, X-as-a-service activity will increase from about 15% today to 35% by 2021. Given that it is estimated that the global Big Data market will be worth $88 billion by that point, we can see that the forecast value of the BDaaS market could be $30 billion. So, here I will attempt to give a brief overview of the concept, as well as examples of how it is being put into practice in real life businesses and organizations around the world.
What is Big Data-As-A-Service? 
Big Data refers to the ever-growing amount of information we are creating and storing, and the analysis and use of this data. In a business sense, it particularly refers to applying insights gleaned from this analysis in order to drive business growth. At the moment, Big Data-As-A-Service is a somewhat nebulous term often used to describe a wide variety of outsourcing of various Big Data functions to the cloud. This can range from the supply of data, to the supply of analytical tools with which to interrogate the data (often through a web dashboard or control panel) to carrying out the actual analysis and providing reports. Some Big Data-As-A-Service providers also include consulting and advisory services within their Big Data-As-A-Service packages.
Why is Big Data-As-A-Service useful?
There are several advantages to outsourcing or virtualizing your analytics activities involving large data-sets. The popularity of Hadoop has to some extent democratized Big Data – anyone can use cheap off-the-shelf hardware and open source software to analyze data, if they invest time learning how. But most commercial Big Data initiatives will still involve money being spent up front on components and infrastructure. When a large company launches a major initiative, this is likely to be substantial. On top of upfront costs, storing and managing large quantities of information requires an ongoing investment of time and resources. When you use BDaaS, all of the techy “nuts and bolts” are, in theory, out of sight and out of mind, leaving you free to concentrate on business issues. Big Data-As-A-Service providers generally take this on for the customer – they have everything set up and ready to go – and you simply rent the use of their cloud-based storage and analytics engines and pay either for the time you use them or the amount of data crunched. Big Data-As-A-Service providers often take on the cost of compliance and data protection. When the data is stored on their servers, they are (generally) responsible for it. A good example would be Health Records Analytics for as a service, a service that provides user access to medical records analysis on their medical records since the day they were born. The service provides analytical tools and applications for making sense of multiple reports done over years.

WIDI : Get your Netgear PUSH2TV PTV1000 work with Windows 8

When WIDI was new I had bought PTV1000 which is an excellent WIDI adapter, But with advances in WIFI drivers and Windows OS the device is no longer compatible with Windows 8 onwards which is rather unfortunate. Technology should not make workable devices absolute because of compatibility issues.

Anyway I finally found the way to get PTV1000 working with Windows 8. All you need to do is uninstall your PROset Wireless driver and install Intel Wireless_15.3.1_Ds64.exe. PTV100 only works with Wireless_15.3.1_Ds64.exe wireless driver and this older driver does not affect the performance of your WIFI.

Hope this helps other who want to continue to use their old & robust Push2TV device. Why am I still on Windows 8 is another matter. As a developer I find Windows 8.1 and Windows 10 of not much use to me and they only slow down my laptop.

Tuesday, February 7

Project Demonetization : Could they have done a better implementation?

When experienced program/project managers looks at Indian Demonetization Exercise (8th Nov 2016) they are either critical of the implementation or else they simply want to shoot the manager of this exercise Point blank. No regrets.  Those managers who don't believe in Capital Punishment & instant justice would rather brainstorm and think how they could have done a fool proof implementation if they were in shoes of Finance Minister or Prime Ministers and the IAS (Indian Administrative Services) officers who call themselves 'Planning Commission' & do the planning for Government of India.


In my lifetime Indian Demonetization is probably the biggest real life project implementation where I was impacted as a end user in different roles of a boss, an employee, a father, a son of senior citizen parents & also of a project manager who feels that we could guide the government to get things back on track but the government did not have time to listen to public. I consider demonetization to be a practical lesson on
'How a project manager can screw a good project when
1) The project manager does not study how routine business is conducted (in this case by different businesses of the entire country)

2) The project manager does not capture the complete requirements of the project & get the requirements reviewed by experts

3) The project manager does not consider how different business would be impacted by his decisions, he does not consider the risks & plan for mitigation (happens when manager thinks he is too smart to consult experts)

4) The project manager does not 'self-review' his plans and does not get plans reviewed by an independent reviewer because he is overconfident & over smart

5) The project manager allows his ego to become bigger than the success of the project and even after knowing his mistakes he does not accept his mistake 

6) The project manager does not consider the need to review the 'Preparedness of Supporting Services' that could hamper or delay or fail the implementation of the project or cause serious losses to the business

In my next post I want to spend some time to 'think aloud' & discuss all the 'things-that-went-wrong' during implementation of demonetization, how it affected lives of common man and small businesses & how 'an average program manager could have done a much better job by covering  basics of program management to ensure a much better and smoother implementation of Demonetization. 


Monday, January 30

Is your Home WIFI secure?

It is important to realize that your WiFi Network does not end at your home walls. It is possible for the network to extend over 300 feet through the air. If your wireless access point is not properly secured, people from other homes, offices or nearby buildings can gain access to it. Even a passwrby can get access to your network by using free mobile apps that can scan for unsecured networks. It is vital that you take proper preventative measures in securing the device to protect your network. People who are able to connect to your wireless router or network may be able to do the following:

  1. Access your computer & view all the files on your computer or spread a virus
  2. View all the websites that you visit, read all your emails as they travel through the network, copy your log-in names and passwords using a hidden software and then hack into your accounts bank account
  3. Slow down your computer or laptop and the Internet connection speed
  4. Send spam and/or perform illegal activities like hacking, so threat/hate messaging using your Internet connection


Most companies and individuals go to great lengths to ensure that unauthorized users cannot access their WiFi Network. However, wireless access points can provide hackers with a few convenient ways to access it. This is because wifi signals are frequently broadcasted past the walls of the company and throughout the immediate area, enticing the hackers to get in.

Most people connect to the wireless network utilizing their mobile devices, such as Smartphones, tablets, Smart tv and laptops, as it is not exactly practical to switch off their wifi access. Below you will find tips on how to ensure that your IT network is more secure:

Use WiFi Protected Access (WPA)

Wired Equivalent Privacy (WEP) standard of security is old & broken, which means that hackers can easily break into the WEP-protected network utilizing a hacking method such as Aircrack--ng. To avert hackers from accessing your WiFi Network, it is vital that you use some form of deviation like WiFi Protected Access (WPA) protection. Either the WPA or the recent WPA2 standard is ideal.

Utilize A Secure WPA Passwordsecure Wifi 
It is recommended to create a randomly long password or passphrase to protect your wireless network. The randomly long password or passphrase can make it difficult for intruders to hack into your network. Take the time to test the security of the WPA protected network by using a service like CloudCracker.

In order for the test to succeed, you should not reveal your password/passphrase. Once this is done, you will be asked to provide some data/information (typically data/information that hackers could capture via a device from anywhere within the range of your WiFi Network). The service will do everything to extract your password or passphrase.

Check For Rogue WiFi Access Points

Rogue wireless access points tend to present a huge security threat. These are not your authorized wireless access points, but the ones that have been brought in by visitors, your computer technician who knows your password or possibly by intruders who have clandestinely connected to one, for instance a wired Ethernet port, and concealed it.

Make A Separate Network Available for Guests

If you have visitors and allow them to use your WiFi Network on a regular basis, it is highly recommended that you provide a separate network for the guests. This means that your guests can still connect to the Internet, but without accessing your primary internal network. This is usually practiced regularly for security purposes and to prevent their guests from unintentionally infecting their primary network with viruses or malware.

Is someone using my wifi network?
  1. SoftPerfect WiFi Guard is basic version of the SoftPerfect Network Scanner which is more suited for detecting unknown or unauthorized network connections. Good this about this tool is that it will scan your network for connected devices and re-scan every xx minutes, popping up a message if an unknown connection has been found. This is my favorite toolsoftperfect wifi guard
  2. Wireless Network Watcher is one of his many utilities that can tell you who all are using your wifi network. The good thing is it requires no setting up of IP address ranges and starts scanning your main network adapter automatically for connected devices.
  3. Advanced IP Scanner is an all round network administration tool that can do a number of tasks in addition to scanning your network for connections. There’s also remote options to Wake-on-LAN and shutdown, connect via HTTP/FTP as well as remote control with Remote Desktop. These features are unnecessary for simply scanning your network for wireless connections so you can ignore them.                                        advanced ip scanner

<Last updated Jan 2017>

Wednesday, November 30

Data Visualization : Jump Start Plotting With R

Why is data visualization important?

Data Visualization is important because of the way the human brain processes information, using charts or graphs to visualize large amounts of complex data is easier than poring over spreadsheets or reports. Data visualization is a quick, easy way to convey concepts in a universal manner – and you can experiment with different scenarios by making slight adjustments.

Preparing your organization for data visualization technology requires that you first:

  • Understand the data you’re trying to visualize, including its size and cardinality (the uniqueness of data values in a column).
  • Determine what you’re trying to visualize and what kind of information you want to communicate.
  • Know your audience and understand how it processes visual information.
  • Use a visual that conveys the information in the best and simplest form for your audience.
 Here are some simple ways to plot data using R tools.


  1. Basic scatterplot - Main arguments x and y are vectors indicating 
    the x and y coordinates of the data points (in this case, 10).
    Code-
    plot(x = 1:10,
         y = 1:10,
         xlab = "My-XAxis",
         ylab = "My=YAxis",
         main = "Graph Title")
     
     
  2. Using Transparent Colors in plots - Example of basic plotting with color using "yarrr" package transparent color - Most plotting functions have a color argument
     (usually col) that allows you to specify the color of whatever your plotting.
    Code-
    plot(x = pirates$height, 
         y = pirates$weight, 
         col = yarrr::transparent("blue", trans.val = .9), 
         pch = 16, 
         main = "col = yarrr::transparent('blue', .9)") 
  3. Using default R Colors in plots - Most plotting functions have a color argument
     (usually col) that allows you to specify the color of whatever your plotting.
    Code
    plot(x = pirates$height, 
         y = pirates$weight, 
         col = "blue", 
         pch = 16, 
         main = "col ='blue'")
     
     
  4. Plotting scatterplot with arguments - Example of plotting with arguments. he plot() function makes a scatterplot from two vectors x 
    and y, where the x vector indicates the x (horizontal) values of the 
    points, and the y vector indicates the y (vertical) values. 
    Code
    plot(x = 1:10,                         # x-coordinates
         y = 1:10,                         # y-coordinates
         type = "p",                       # Just draw points (no lines)
         main = "My First Plot",
         xlab = "This is the x-axis label",
         ylab = "This is the y-axis label",
         xlim = c(0, 11),                  # Min and max values for x-axis
         ylim = c(0, 11),                  # Min and max values for y-axis
         col = "blue",                     # Color of the points
         pch = 16,                         # Type of symbol (16 means Filled circle)
         cex = 1)                           # Size of the symbols 
     
     
  5. Histograms are the most common way to plot a vector of numeric data.
    Code -
    hist(x = ChickWeight$weight,
         main = "Chicken Weights",
         xlab = "Weight",
         xlim = c(0, 500)) 


  6. Barplot typically shows summary statistics for different groups. 
    The primary argument to a barplot is height: a vector of numeric values which will generate the height of each bar.
    To add names below the bars, use the names.arg argument.  
    Code
    
    barplot(height = 1:5,  # A vector of heights
            names.arg = c("G1", "G2", "G3", "G4", "G5"), # A vector of names
            main = "Example Barplot", 
            xlab = "Group", 
            ylab = "Height")
     
     
  7. Pirateplot is a plot contained in the "yarrr package" written specifically by, and for R pirates The pirateplot is an easy-to-use function that, unlike barplots and boxplots, can easily show raw data, descriptive statistics, and inferential statistics in one plot.
     Code -


     yarrr::pirateplot(formula = weight ~ Time, # dv is weight, iv is Diet
                   data = ChickWeight,
                   main = "Pirateplot of chicken weights",
                   xlab = "Diet",
                   ylab = "Weight")
 

Finally, we can save these graphs as pdf file using pdf function of R
Code pdf(file = "D:\MyPlot.pdf",   # The directory you want to save the file in
    width = 4, # The width of the plot in inches
    height = 4) # The height of the plot in inches

# Step 2: Create the plot with R code
plot(x = 1:10,
     y = 1:10)
abline(v = 0) # Additional low-level plotting commands
text(x = 0, y = 1, labels = "Random text")

# Step 3: Run dev.off() to create the file!
dev.off()


Understanding Generative AI and Generative AI Platform leaders

We are hearing a lot about power of Generative AI. Generative AI is a vertical of AI that  holds the power to #Create content, artwork, code...