Friday, January 29

Artificial Intelligence (AI) in healthcare industry - What to look for in 2021 and 2022 ?

Overview of AI in Healthcare 


Chart : https://www.statista.com

Artificial Intelligence and Machine Learning systems proved that machines are better and faster than humans analyzing big data. Today, organizations have large datasets of patient data and insights about diseases through techniques like Genome Wide Association Studies (GWAS). Using AI, healthcare providers can analyze and interpret the available patient data more precisely for early diagnosis and better treatment. Today, it is possible to say whether a person has the chance to get cancer from a selfie using computer vision and machine learning to detect increased bilirubin levels in a person’s sclera, the white part of the eye. 

Why AI in Healthcare?

  1. Better patient care: AI can provide better patient care by detecting diseases earlier and offering more efficient treatment methods. According to Frost & Sullivan’s research, AI has the potential to improve healthcare outcomes by 30 – 40%.
  2. Data-driven decision-making: With machine learning algorithms, AI can document and offer more insights about a patient’s status and help doctors make better data-driven decisions by providing a better picture.
  3. Time & cost saving for administrative tasks: AI can handle administrative tasks like patient registration, patient data entry, and doctor scheduling for appointment requests.

AI Healthcare Market

In 2016 AI healthcare market was estimated to be around $0.66 B 

In 2021 AI market was expected to grow by 10 times to $6.7 billion. 

In 2019 estimate is 41.7% compound annual growth rate to $1.3 billion 

In 2025 the AI healthcare market is projected to be $13 billion

Over the last 4 years there has been a horizontal expansion in areas of implementation in healthcare. Companies like Cerner Corporation, IBM, McKesson Corporation ,GE Healthcare, Telstra Health, HotDocs, Health Engine are leading the healthcare revolution across the world.

So what are the areas where AI is  revolutionizing healthcare industry? Here is my list of top 18 areas of focus for AI Healthcare across the world in 2021-2022

1- Assisted or automated diagnosis & prescription: Chatbots can help patients self diagnose or assist doctors in diagnosis. 

2- Prescription auditing: AI audit systems can help minimize prescription errors.

3- Pregnancy Management: Monitor mother and fetus to reduce mother’s worries and enable early diagnosis

4- Real-time prioritization and triage: Prescriptive analytics on patient data to enable accurate real-time case prioritization and triage.  

5- Personalized medications and care: Analyze patient data to find the most effective and personalized treatment  and helps reducing cost and increasing effectiveness of care. 

6- Patient Data Analytics: Analyze patient and/or 3rd party data to discover insights and suggest actions.  AI allows the institution (hospital, etc…) analyze clinical data and generate deep insights into patient health. It provides an opportunity to reduce cost of care, use resources efficiently, and manage population health easily.

 7-Surgical robots: Robot-assisted surgeries combines AI and collaborative robots. These robots are well-suited for procedures that require the same, repetitive movements as they are able to work without fatigue. AI can identify patterns within surgical procedures to improve best practices and to improve a surgical robots’ control accuracy to sub-millimeter precision.

8- Early diagnosis: Analyze chronic conditions leveraging lab data and other medical data to enable early diagnosis 

9- Medical Imaging : Advanced medical imaging to analyze and transform images and model possible situations.  

10- Drug discovery: Find new drugs based on previous data and medical intelligence. 

11- Gene analysis and editing: Understand genes and their components. Predict the impact of gene edits.

12- Device and drug comparative effectiveness : Helps review if drug or a new medical device are effective

13- Brand management and marketing: Create an optimal marketing strategy for the brand based on market perception and target segment. 

14- Pricing and risk: Determine the optimal price for treatment and other service according to competition and other market conditions.

15- Market research: Prepare hospital competitive intelligence. 

16- Operations: Process automation technologies such as intelligent automation and RPA help hospitals automate routine front office and back office operations such as reporting. 

17- Customer service chat-bots: Customer service chat-bots allow patients to ask questions regarding bill payment, appointments, or medication refills. 

18- Fraud detection: Patients may make false claims. Leveraging AI powered Fraud Detection tools can help hospital managers to identify fraudsters.


Useful Links

Cobot - https://research.aimultiple.com/cobot/ 

Friday, August 28

AWS : Leader in Gartner's Quadrant 2020

AWS has been named as a Leader in the Magic Quadrant for Cloud Infrastructure and Platform Services - 2020. The AWS is placed highest in Ability to Execute and furthest in Completeness of Vision. As compared to Azure it has 4X market customers base.

Leaders Quadrant

    1) AWS (2006)

    2) Microsoft Azure (2010)

    3) Google (2011)

Challenger's Quadrant - No cloud provider

Nice Player Quadrant -

    1) Alibaba 

    2) Oracle

    3) IBM

    4) Tencent Cloud

Visionaries Quadrant- No cloud provider


AWS Vs Azure Vs Google Cloud: Market Shares and Growth Rate

In terms of cloud market, AWS has been the market leader since beginning. If you take a look at the following graph, it clearly depicts that:

  • AWS is leading with around 30 percent of public cloud share and rest i
  • Microsoft Azure is on the second place, owning around 16 percent of the worldwide market share.
  • Google, on the third place, owns up to 10 percent of the market share worldwide.


  • AWS has 5 years advantage over GCP & Azure.
  • AWS is has better reach and available across more zones than GCP and Azure
  • AWS has one-third of market shares in its name and is clear leader
  • AWS has good growth rate but GCP is closing on with 100 percent growth
  • Services offering of AWS, Azure, GCP :
    • When it comes to the number of services, the winner is AWS.
    • Regarding the integration with open-source and on-premise systems, such as MS tools, that are mostly used in almost all organizations, the winner is Azure.
  • Pricing Models: Google Cloud has most economical pricing but Azure and AWS are quite close and AWS has more features and services as compared to GCP.


Saturday, August 1

Data Preprocessing - Binning ( Data Science and stuff)

A simple, yet powerful concept used during data analysis that categorizes the data into different buckets/bins. One important point to remember is that “binning” and “clustering” are not the same and vary considerably in logic and implementation. Binning as a method of data pre-processing. Data binning (or bucketing) groups data in bins (or buckets), in the sense that it replaces values contained into a small interval with a single representative value for that interval. Sometimes binning improves accuracy in predictive models.

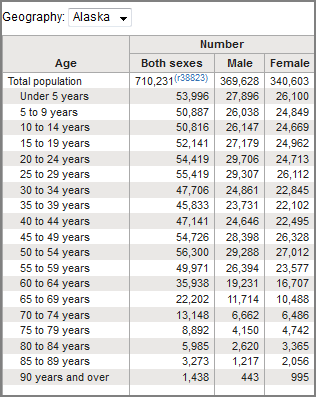
For example, if you have census data, you can bin “age” into [0 to 5], [5 to 9], [10 to 14] and so on.

Image of binning census data by age group -

Alaska census data.


Sometimes, binning can improve accuracy of the predictive models. In addition, sometimes we use data binning to group a set of numerical values into a smaller number of bins to have a better understanding of the data distribution. 

As example, “a automobile price” is an attribute range from 5,000 to 45,500.
Using binning, we categorize the price into three bins: low price, medium price, and high
prices. In the actual automobile dataset, ”price" is a numerical variable ranging from 5188 to 45400,
it has 201 unique values. We can categorize them into 3 bins: low, medium, and high-priced cars.
In Python we can easily implement the binning: We would like 3 bins of equal binwidth, so
we need 4 numbers as dividers that are equal distance apart.
1) First we use the numpy function “linspace” to return the array “bins” that contains
4 equally spaced numbers over the specified interval of the price.                                                       2)We create a list “group_names “ that contains the different bin names.
3) We use the pandas function ”cut” to segment and sort the data values into bins.
We can then use histograms to visualize the distribution of the data after they’ve been
divided into bins. This is sample histogram that we plotted based on the binning that we applied in the price feature. From the histogram plot, it is clear that most cars have a low price, and only very few cars have high price.

Another example of binning employee data by salary.

https://wisdomschema.com/wp-content/uploads/2015/12/Data_Binning_1.png

MUSTREAD : How can you use Index Funds to help create wealth? HDFC MF Weekend Bytes

https://www.hdfcfund.com/knowledge-stack/mf-vault/weekend-bytes/how-can-you-use-index-funds-help-create-wealth?utm_source=Netcore...